ICA is fit to MEG raw data. We assume that the non-stationary EOG artifacts have already been removed. The sources matching the ECG are automatically found and displayed.
Note that this example does quite a bit of processing, so even on a fast machine it can take about a minute to complete.
# Authors: Denis Engemann <denis.engemann@gmail.com>
#
# License: BSD (3-clause)

import mne
from mne.preprocessing import ICA, create_ecg_epochs
from mne.datasets import sample

print(__doc__)
Read and preprocess the data. Preprocessing consists of:
data_path = sample.data_path()
raw_fname = data_path + '/MEG/sample/sample_audvis_filt-0-40_raw.fif'

raw = mne.io.read_raw_fif(raw_fname, preload=True)
raw.pick_types(meg=True, eeg=False, exclude='bads', stim=True)
raw.filter(1, 30)

# longer + more epochs for more artifact exposure
events = mne.find_events(raw, stim_channel='STI 014')
epochs = mne.Epochs(raw, events, event_id=None, tmin=-0.2, tmax=0.5)
Out:
Opening raw data file /home/ubuntu/mne_data/MNE-sample-data/MEG/sample/sample_audvis_filt-0-40_raw.fif...
    Read a total of 4 projection items:
        PCA-v1 (1 x 10²)  idle
        PCA-v2 (1 x 10²)  idle
        PCA-v3 (1 x 10²)  idle
        Average EEG reference (1 x 60)  idle
    Range : 6450 ... 48149 =     42.956 ...   320.665 secs
Ready.
Current compensation grade : 0
Reading 0 ... 41699  =      0.000 ...   277.709 secs...
Setting up band-pass filter from 1 - 30 Hz
l_trans_bandwidth chosen to be 1.0 Hz
h_trans_bandwidth chosen to be 7.5 Hz
Filter length of 991 samples (6.600 sec) selected
319 events found
Events id: [ 1  2  3  4  5 32]
319 matching events found
Created an SSP operator (subspace dimension = 3)
4 projection items activated
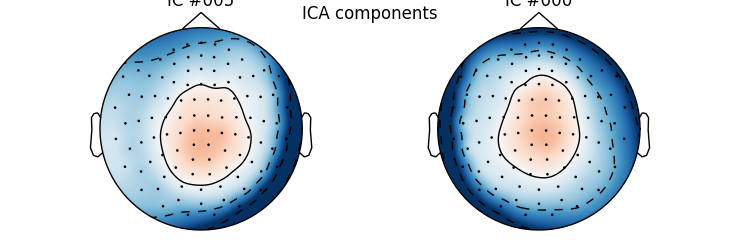
Fit ICA model using the FastICA algorithm, detect and plot components explaining ECG artifacts.
ica = ICA(n_components=0.95, method='fastica').fit(epochs)

ecg_epochs = create_ecg_epochs(raw, tmin=-.5, tmax=.5)
ecg_inds, scores = ica.find_bads_ecg(ecg_epochs)

ica.plot_components(ecg_inds)
Out:
Fitting ICA to data using 305 channels.
Please be patient, this may take some time
Inferring max_pca_components from picks.
Loading data for 319 events and 106 original time points ...
0 bad epochs dropped
Selection by explained variance: 125 components
Loading data for 319 events and 106 original time points ...
Reconstructing ECG signal from Magnetometers
Setting up band-pass filter from 8 - 16 Hz
Number of ECG events detected : 284 (average pulse 61 / min.)
Creating RawArray with float64 data, n_channels=1, n_times=41700
    Range : 0 ... 41699 =      0.000 ...   277.709 secs
Ready.
284 matching events found
Created an SSP operator (subspace dimension = 3)
Loading data for 284 events and 151 original time points ...
0 bad epochs dropped
Plot properties of ECG components:
ica.plot_properties(epochs, picks=ecg_inds)


Out:
Loading data for 319 events and 106 original time points ...
Total running time of the script: ( 1 minutes 21.509 seconds)