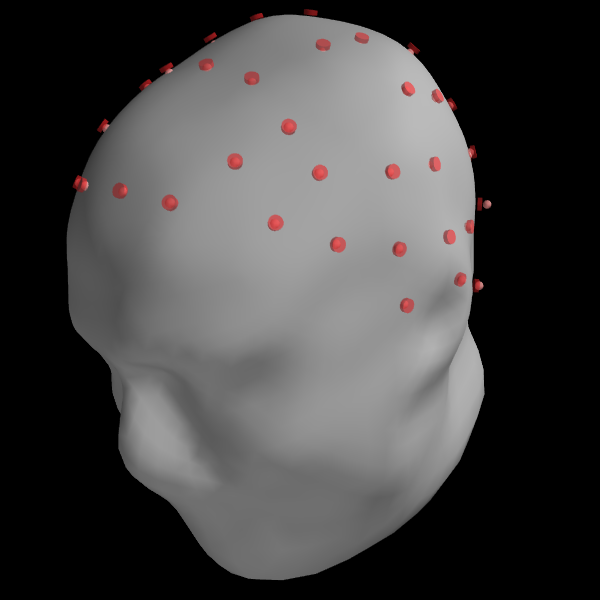
In this example, digitized EEG sensor locations are shown on the scalp.
Out:
Opening raw data file /home/ubuntu/mne_data/MNE-sample-data/MEG/sample/sample_audvis_raw.fif...
    Read a total of 3 projection items:
        PCA-v1 (1 x 10²)  idle
        PCA-v2 (1 x 10²)  idle
        PCA-v3 (1 x 10²)  idle
    Range : 25800 ... 192599 =     42.956 ...   320.670 secs
Ready.
Current compensation grade : 0
Using surface from /home/ubuntu/mne_data/MNE-sample-data/subjects/sample/bem/sample-5120-5120-5120-bem.fif.
# Author: Eric Larson <larson.eric.d@gmail.com>
#
# License: BSD (3-clause)

import mne
from mne.viz import plot_trans
from mayavi import mlab

print(__doc__)

data_path = mne.datasets.sample.data_path()
subjects_dir = data_path + '/subjects'
trans = mne.read_trans(data_path + '/MEG/sample/sample_audvis_raw-trans.fif')
raw = mne.io.read_raw_fif(data_path + '/MEG/sample/sample_audvis_raw.fif')
fig = plot_trans(raw.info, trans, subject='sample', dig=False,
                 eeg_sensors=['original', 'projected'],
                 meg_sensors=[], coord_frame='head', subjects_dir=subjects_dir)
mlab.view(135, 80)
Total running time of the script: ( 0 minutes 0.564 seconds)