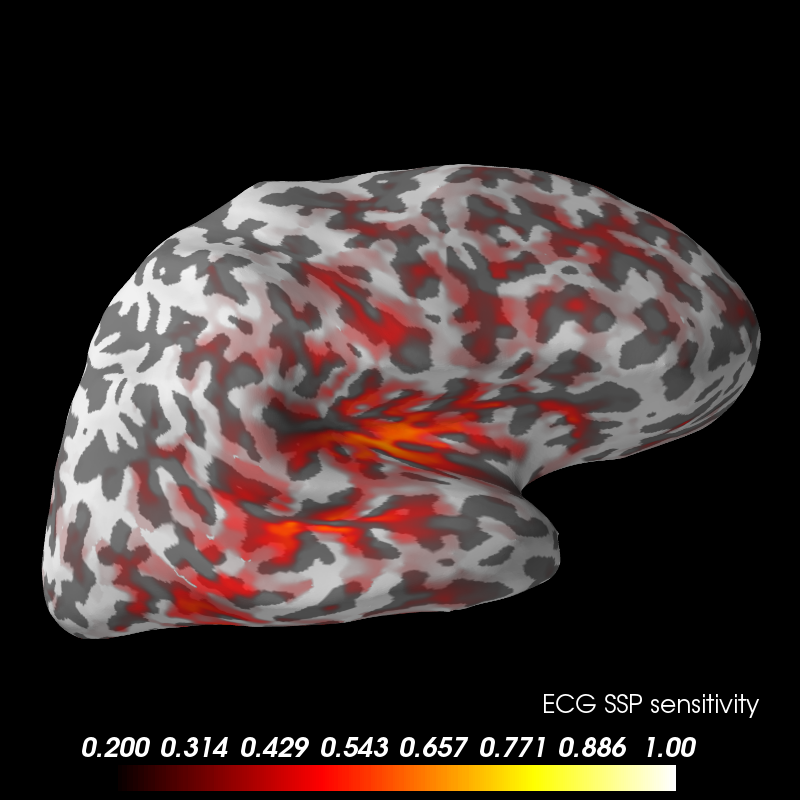
This example shows the sources that have a forward field similar to the first SSP vector correcting for ECG.
# Author: Alexandre Gramfort <alexandre.gramfort@telecom-paristech.fr>
#
# License: BSD (3-clause)

import matplotlib.pyplot as plt

from mne import read_forward_solution, read_proj, sensitivity_map
from mne.datasets import sample

print(__doc__)

data_path = sample.data_path()

subjects_dir = data_path + '/subjects'
fname = data_path + '/MEG/sample/sample_audvis-meg-eeg-oct-6-fwd.fif'
ecg_fname = data_path + '/MEG/sample/sample_audvis_ecg-proj.fif'

fwd = read_forward_solution(fname, surf_ori=True)
projs = read_proj(ecg_fname)
# take only one projection per channel type
projs = projs[::2]

# Compute sensitivity map
ssp_ecg_map = sensitivity_map(fwd, ch_type='grad', projs=projs, mode='angle')
Out:
Reading forward solution from /home/ubuntu/mne_data/MNE-sample-data/MEG/sample/sample_audvis-meg-eeg-oct-6-fwd.fif...
    Reading a source space...
    Computing patch statistics...
    Patch information added...
    Distance information added...
    [done]
    Reading a source space...
    Computing patch statistics...
    Patch information added...
    Distance information added...
    [done]
    2 source spaces read
    Desired named matrix (kind = 3523) not available
    Read MEG forward solution (7498 sources, 306 channels, free orientations)
    Desired named matrix (kind = 3523) not available
    Read EEG forward solution (7498 sources, 60 channels, free orientations)
    MEG and EEG forward solutions combined
    Source spaces transformed to the forward solution coordinate frame
    Converting to surface-based source orientations...
    Average patch normals will be employed in the rotation to the local surface coordinates....
[done]
    Read a total of 6 projection items:
        ECG-planar-999--0.200-0.400-PCA-01 (1 x 203)  idle
        ECG-planar-999--0.200-0.400-PCA-02 (1 x 203)  idle
        ECG-axial-999--0.200-0.400-PCA-01 (1 x 10²)  idle
        ECG-axial-999--0.200-0.400-PCA-02 (1 x 10²)  idle
        ECG-eeg-999--0.200-0.400-PCA-01 (1 x 59)  idle
        ECG-eeg-999--0.200-0.400-PCA-02 (1 x 59)  idle
    204 out of 366 channels remain after picking
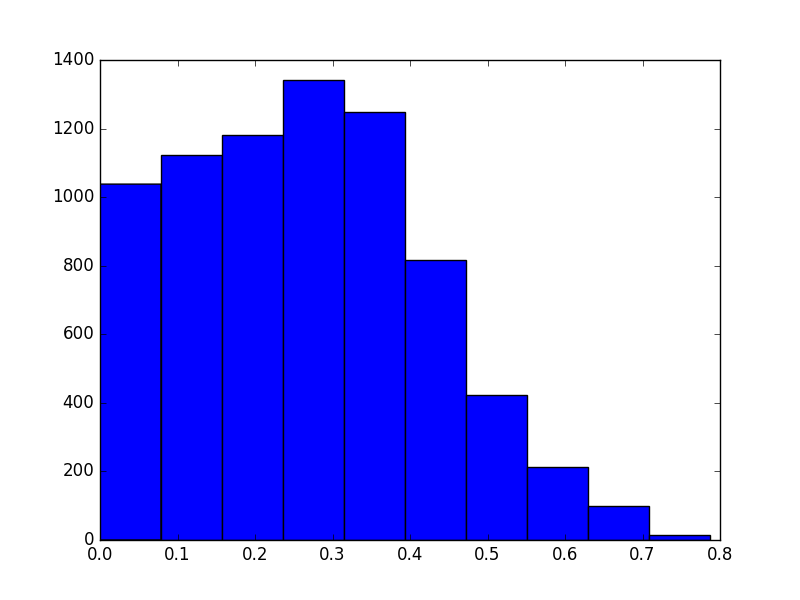
Show sensitivity map
Out:
Updating smoothing matrix, be patient..
Smoothing matrix creation, step 1
Smoothing matrix creation, step 2
Smoothing matrix creation, step 3
Smoothing matrix creation, step 4
Smoothing matrix creation, step 5
Smoothing matrix creation, step 6
Smoothing matrix creation, step 7
colormap: fmin=2.00e-01 fmid=6.00e-01 fmax=1.00e+00 transparent=1
Total running time of the script: ( 0 minutes 13.699 seconds)