This script shows how to estimate significant clusters in time-frequency power estimates. It uses a non-parametric statistical procedure based on permutations and cluster level statistics.
The procedure consists in:
- extracting epochs
- compute single trial power estimates
- baseline line correct the power estimates (power ratios)
- compute stats to see if ratio deviates from 1.
# Authors: Alexandre Gramfort <alexandre.gramfort@telecom-paristech.fr>
#
# License: BSD (3-clause)

import numpy as np
import matplotlib.pyplot as plt

import mne
from mne.time_frequency import tfr_morlet
from mne.stats import permutation_cluster_1samp_test
from mne.datasets import sample

print(__doc__)
data_path = sample.data_path()
raw_fname = data_path + '/MEG/sample/sample_audvis_raw.fif'
tmin, tmax, event_id = -0.3, 0.6, 1

# Setup for reading the raw data
raw = mne.io.read_raw_fif(raw_fname)
events = mne.find_events(raw, stim_channel='STI 014')

include = []
raw.info['bads'] += ['MEG 2443', 'EEG 053']  # bads + 2 more

# picks MEG gradiometers
picks = mne.pick_types(raw.info, meg='grad', eeg=False, eog=True,
                       stim=False, include=include, exclude='bads')

# Load condition 1
event_id = 1
epochs = mne.Epochs(raw, events, event_id, tmin, tmax, picks=picks,
                    baseline=(None, 0), preload=True,
                    reject=dict(grad=4000e-13, eog=150e-6))

# Take only one channel
ch_name = 'MEG 1332'
epochs.pick_channels([ch_name])

evoked = epochs.average()

# Factor to down-sample the temporal dimension of the TFR computed by
# tfr_morlet. Decimation occurs after frequency decomposition and can
# be used to reduce memory usage (and possibly computational time of downstream
# operations such as nonparametric statistics) if you don't need high
# spectrotemporal resolution.
decim = 5
frequencies = np.arange(8, 40, 2)  # define frequencies of interest
sfreq = raw.info['sfreq']  # sampling in Hz
tfr_epochs = tfr_morlet(epochs, frequencies, n_cycles=4., decim=decim,
                        average=False, return_itc=False, n_jobs=1)

# Baseline power
tfr_epochs.apply_baseline(mode='logratio', baseline=(-.100, 0))

# Crop in time to keep only what is between 0 and 400 ms
evoked.crop(0., 0.4)
tfr_epochs.crop(0., 0.4)

epochs_power = tfr_epochs.data[:, 0, :, :]  # take the 1 channel
Out:
Opening raw data file /home/ubuntu/mne_data/MNE-sample-data/MEG/sample/sample_audvis_raw.fif...
    Read a total of 3 projection items:
        PCA-v1 (1 x 10²)  idle
        PCA-v2 (1 x 10²)  idle
        PCA-v3 (1 x 10²)  idle
    Range : 25800 ... 192599 =     42.956 ...   320.670 secs
Ready.
Current compensation grade : 0
320 events found
Events id: [ 1  2  3  4  5 32]
72 matching events found
3 projection items activated
Loading data for 72 events and 541 original time points ...
    Rejecting  epoch based on EOG : [u'EOG 061']
    Rejecting  epoch based on EOG : [u'EOG 061']
    Rejecting  epoch based on EOG : [u'EOG 061']
    Rejecting  epoch based on EOG : [u'EOG 061']
    Rejecting  epoch based on EOG : [u'EOG 061']
    Rejecting  epoch based on EOG : [u'EOG 061']
    Rejecting  epoch based on EOG : [u'EOG 061']
    Rejecting  epoch based on EOG : [u'EOG 061']
    Rejecting  epoch based on EOG : [u'EOG 061']
    Rejecting  epoch based on EOG : [u'EOG 061']
    Rejecting  epoch based on EOG : [u'EOG 061']
    Rejecting  epoch based on EOG : [u'EOG 061']
    Rejecting  epoch based on EOG : [u'EOG 061']
    Rejecting  epoch based on EOG : [u'EOG 061']
    Rejecting  epoch based on EOG : [u'EOG 061']
    Rejecting  epoch based on EOG : [u'EOG 061']
    Rejecting  epoch based on EOG : [u'EOG 061']
    Rejecting  epoch based on EOG : [u'EOG 061']
18 bad epochs dropped
Applying baseline correction (mode: logratio)
threshold = 2.5
T_obs, clusters, cluster_p_values, H0 = \
    permutation_cluster_1samp_test(epochs_power, n_permutations=100,
                                   threshold=threshold, tail=0)
Out:
stat_fun(H1): min=-3.514155 max=7.583506
Running initial clustering
Found 9 clusters
Permuting ...

[                                        ] 1.00000 |
[............                            ] 32.00000 /
[.........................               ] 64.00000 -
[......................................  ] 96.00000 \    Computing cluster p-values
Done.
evoked_data = evoked.data
times = 1e3 * evoked.times
plt.figure()
plt.subplots_adjust(0.12, 0.08, 0.96, 0.94, 0.2, 0.43)
# Create new stats image with only significant clusters
T_obs_plot = np.nan * np.ones_like(T_obs)
for c, p_val in zip(clusters, cluster_p_values):
if p_val <= 0.05:
T_obs_plot[c] = T_obs[c]
vmax = np.max(np.abs(T_obs))
vmin = -vmax
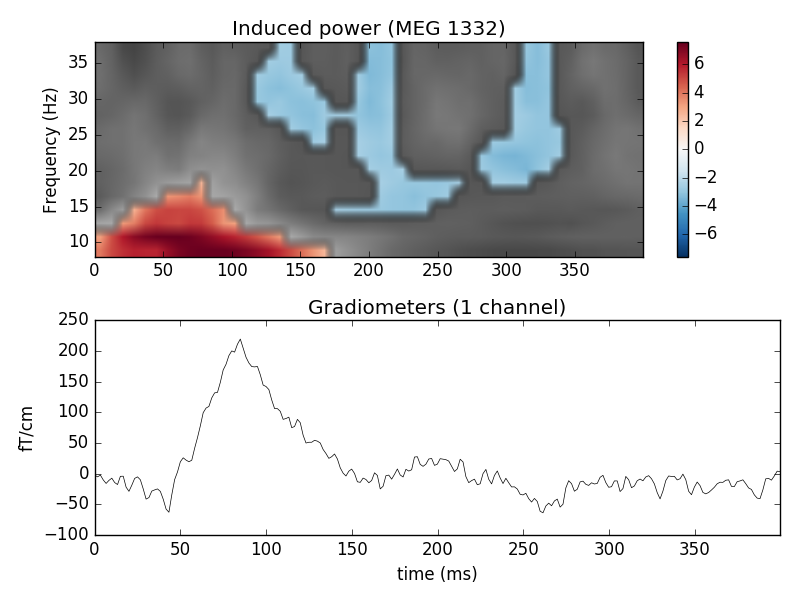
plt.subplot(2, 1, 1)
plt.imshow(T_obs, cmap=plt.cm.gray,
extent=[times[0], times[-1], frequencies[0], frequencies[-1]],
aspect='auto', origin='lower', vmin=vmin, vmax=vmax)
plt.imshow(T_obs_plot, cmap=plt.cm.RdBu_r,
extent=[times[0], times[-1], frequencies[0], frequencies[-1]],
aspect='auto', origin='lower', vmin=vmin, vmax=vmax)
plt.colorbar()
plt.xlabel('Time (ms)')
plt.ylabel('Frequency (Hz)')
plt.title('Induced power (%s)' % ch_name)
ax2 = plt.subplot(2, 1, 2)
evoked.plot(axes=[ax2])
plt.show()
Total running time of the script: ( 0 minutes 1.480 seconds)