mne.viz.plot_head_positions

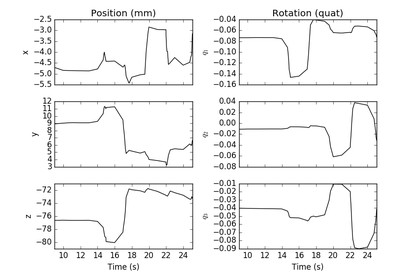
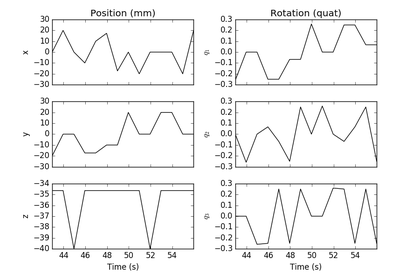
mne.viz.plot_head_positions(pos, mode=’traces’, cmap=’viridis’, direction=’z’, show=True)[source]

Plot head positions.

Parameters:

pos : ndarray, shape (n_pos, 10)

The head position data.

mode : str

Can be ‘traces’ (default) to show position and quaternion traces, or ‘field’ to show the position as a vector field over time. The ‘field’ mode requires matplotlib 1.4+.

cmap : matplotlib Colormap

Colormap to use for the trace plot, default is “viridis”.

direction : str

Can be any combination of “x”, “y”, or “z” (default: “z”) to show directional axes in “field” mode.

show : bool

Show figure if True. Defaults to True.

Returns:

fig : Instance of matplotlib.figure.Figure

The figure.