This quick start will show you how to run the mne report command on the sample data set provided with MNE.
First ensure that the files you want to render follow the filename conventions defined by MNE:
| Data object | Filename convention (ends with) |
|---|---|
| raw | -raw.fif(.gz), -raw_sss.fif(.gz), -raw_tsss.fif(.gz) |
| events | -eve.fif(.gz) |
| epochs | -epo.fif(.gz) |
| evoked | -ave.fif(.gz) |
| covariance | -cov.fif(.gz) |
| trans | -trans.fif(.gz) |
| forward | -fwd.fif(.gz) |
| inverse | -inv.fif(.gz) |
To generate a barebones report from all the *.fif files in the sample dataset, invoke the following command in a system (e.g., Bash) shell:
$ mne report --path MNE-sample-data/ --verbose
On successful creation of the report, it will open the html in a new tab in the browser. To disable this, use the –no-browser option.
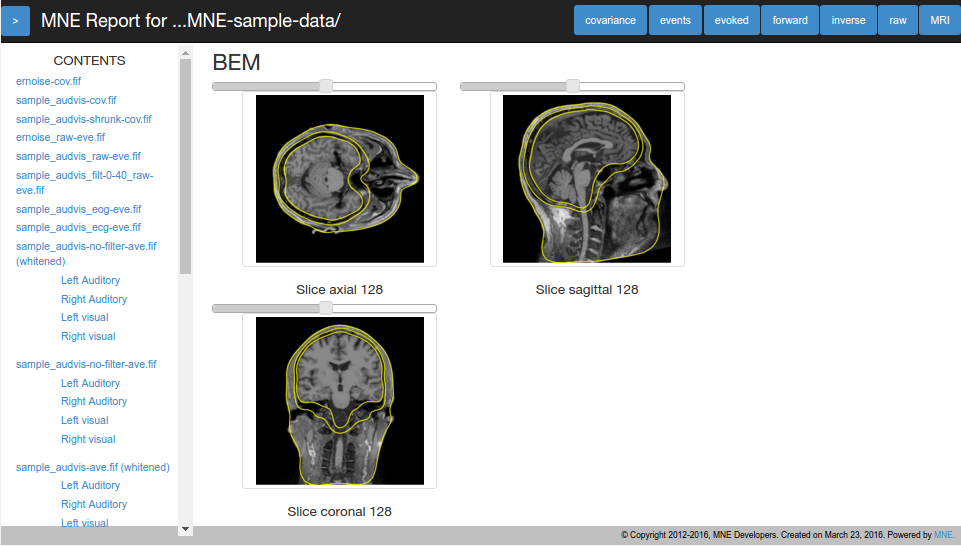
If the report is generated for a single subject, give the SUBJECT name and the
SUBJECTS_DIR and this will generate the MRI slices (with BEM contours overlaid on top
if available):
$ mne report --path MNE-sample-data/ --subject sample --subjects-dir MNE-sample-data/subjects --verbose
To properly render trans and covariance files, add the measurement information:
$ mne report --path MNE-sample-data/ --info MNE-sample-data/MEG/sample/sample_audvis-ave.fif \
      --subject sample --subjects-dir MNE-sample-data/subjects --verbose
To render whitened evoked files with baseline correction, add the noise covariance file:
$ mne report --path MNE-sample-data/ --info MNE-sample-data/MEG/sample/sample_audvis-ave.fif \
      --cov MNE-sample-data/MEG/sample/sample_audvis-cov.fif --bmax 0 --subject sample \
      --subjects-dir MNE-sample-data/subjects --verbose
To generate the report in parallel:
$ mne report --path MNE-sample-data/ --info MNE-sample-data/MEG/sample/sample_audvis-ave.fif \
      --subject sample --subjects-dir MNE-sample-data/subjects --verbose --jobs 6
The report rendered on sample-data is shown below:
For help on all the available options, do:
$ mne report --help
The same functionality can also be achieved using the Python interface. Import the required functions:
>>> from mne.report import Report
>>> from mne.datasets import sample
Generate the report:
>>> path = sample.data_path()
>>> report = Report(verbose=True)
Embedding : jquery-1.10.2.min.js
Embedding : jquery-ui.min.js
Embedding : bootstrap.min.js
Embedding : jquery-ui.min.css
Embedding : bootstrap.min.css
Only include *audvis_raw.fif and *-eve.fif files in the report:
>>> report.parse_folder(data_path=path, pattern=['*audvis_raw.fif', '*-eve.fif'])
Iterating over 6 potential files (this may take some time)
Rendering : /home/mainak/Desktop/projects/mne-python/examples/MNE-sample-data/MEG/sample/sample_audvis_raw.fif
Opening raw data file /home/mainak/Desktop/projects/mne-python/examples/MNE-sample-data/MEG/sample/sample_audvis_raw.fif...
    Read a total of 3 projection items:
        PCA-v1 (1 x 10²)  idle
        PCA-v2 (1 x 10²)  idle
        PCA-v3 (1 x 10²)  idle
Current compensation grade : 0
    Range : 25800 ... 192599 =     42.956 ...   320.670 secs
Ready.
Adding average EEG reference projection.
Rendering : /home/mainak/Desktop/projects/mne-python/examples/MNE-sample-data/MEG/sample/sample_audvis_filt-0-40_raw-eve.fif
Rendering : /home/mainak/Desktop/projects/mne-python/examples/MNE-sample-data/MEG/sample/sample_audvis_eog-eve.fif
Rendering : /home/mainak/Desktop/projects/mne-python/examples/MNE-sample-data/MEG/sample/ernoise_raw-eve.fif
Rendering : /home/mainak/Desktop/projects/mne-python/examples/MNE-sample-data/MEG/sample/sample_audvis_raw-eve.fif
Rendering : /home/mainak/Desktop/projects/mne-python/examples/MNE-sample-data/MEG/sample/sample_audvis_ecg-eve.fif
Save the report as an html, but do not open the html in a browser:
>>> report.save('report.html', overwrite=True, open_browser=False)
Rendering : Table of Contents...
There is greater flexibility compared to the command line interface. Custom plots can be added to the report. Let us first generate a custom plot:
>>> from mne import read_evokeds
>>> fname = path + '/MEG/sample/sample_audvis-ave.fif'
>>> evoked = read_evokeds(fname, condition='Left Auditory', baseline=(None, 0), verbose=True)
Reading ...
    Read a total of 4 projection items:
        PCA-v1 (1 x 10²) active
        PCA-v2 (1 x 10²) active
        PCA-v3 (1 x 10²) active
        Average EEG reference (1 x 60) active
    Found the data of interest:
        t =    -199.80 ...     499.49 ms (Left Auditory)
        0 CTF compensation matrices available
        nave = 55 - aspect type = 100
Projections have already been applied. Setting proj attribute to True.
Applying baseline correction ... (mode: mean)
>>> fig = evoked.plot()
To add the custom plot to the report, do:
>>> report.add_figs_to_section(fig, captions='Left Auditory', section='evoked')
>>> report.save('report.html', overwrite=True)
Rendering : Table of Contents...
The MNE report command internally manages the sections so that plots belonging to the same section are rendered consecutively. Within a section, the plots are ordered in the same order that they were added using the add_figs_to_section command. Each section is identified by a toggle button in the navigation bar of the report which can be used to show or hide the contents of the section.
That’s it!