mne.viz.plot_bem

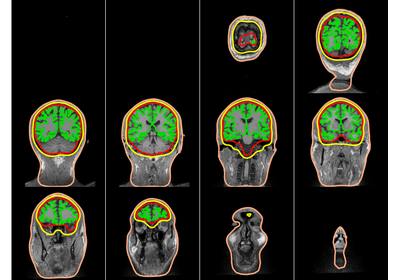
mne.viz.plot_bem(subject=None, subjects_dir=None, orientation=’coronal’, slices=None, brain_surfaces=None, src=None, show=True)[source]

Plot BEM contours on anatomical slices.

Parameters:

subject : str

Subject name.

subjects_dir : str | None

Path to the SUBJECTS_DIR. If None, the path is obtained by using the environment variable SUBJECTS_DIR.

orientation : str

‘coronal’ or ‘axial’ or ‘sagittal’.

slices : list of int

Slice indices.

brain_surfaces : None | str | list of str

One or more brain surface to plot (optional). Entries should correspond to files in the subject’s surf directory (e.g. "white").

src : None | SourceSpaces | str

SourceSpaces instance or path to a source space to plot individual sources as scatter-plot. Only sources lying in the shown slices will be visible, sources that lie between visible slices are not shown. Path can be absolute or relative to the subject’s bem folder.

show : bool

Show figure if True.

Returns:

fig : Instance of matplotlib.figure.Figure

The figure.

Examples using mne.viz.plot_bem