mne.viz.plot_cov

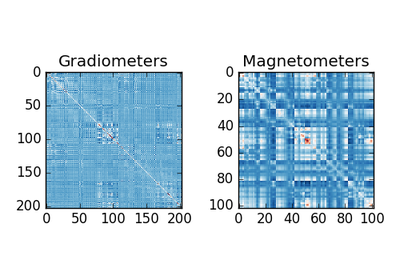
mne.viz.plot_cov(cov, info, exclude=[], colorbar=True, proj=False, show_svd=True, show=True, verbose=None)[source]

Plot Covariance data.

Parameters:

cov : instance of Covariance

The covariance matrix.

info: dict

Measurement info.

exclude : list of string | str

List of channels to exclude. If empty do not exclude any channel. If ‘bads’, exclude info[‘bads’].

colorbar : bool

Show colorbar or not.

proj : bool

Apply projections or not.

show_svd : bool

Plot also singular values of the noise covariance for each sensor type. We show square roots ie. standard deviations.

show : bool

Show figure if True.

verbose : bool, str, int, or None

If not None, override default verbose level (see mne.verbose() and Logging documentation for more).

Returns:

fig_cov : instance of matplotlib.pyplot.Figure

The covariance plot.

fig_svd : instance of matplotlib.pyplot.Figure | None

The SVD spectra plot of the covariance.

Examples using mne.viz.plot_cov