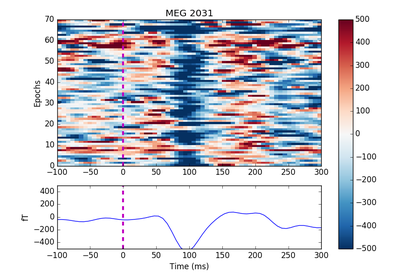
epochs : instance of Epochs
picks : int | array-like of int | None
The indices of the channels to consider. If None, the first
five good channels are plotted.
sigma : float
The standard deviation of the Gaussian smoothing to apply along
the epoch axis to apply in the image. If 0., no smoothing is applied.
vmin : float
The min value in the image. The unit is uV for EEG channels,
fT for magnetometers and fT/cm for gradiometers.
vmax : float
The max value in the image. The unit is uV for EEG channels,
fT for magnetometers and fT/cm for gradiometers.
colorbar : bool
Display or not a colorbar.
order : None | array of int | callable
If not None, order is used to reorder the epochs on the y-axis
of the image. If it’s an array of int it should be of length
the number of good epochs. If it’s a callable the arguments
passed are the times vector and the data as 2d array
(data.shape[1] == len(times).
show : bool
units : dict | None
The units of the channel types used for axes lables. If None,
defaults to units=dict(eeg=’uV’, grad=’fT/cm’, mag=’fT’).
scalings : dict | None
The scalings of the channel types to be applied for plotting.
If None, defaults to scalings=dict(eeg=1e6, grad=1e13, mag=1e15,
eog=1e6).
cmap : matplotlib colormap | (colormap, bool) | ‘interactive’
Colormap. If tuple, the first value indicates the colormap to use and
the second value is a boolean defining interactivity. In interactive
mode the colors are adjustable by clicking and dragging the colorbar
with left and right mouse button. Left mouse button moves the scale up
and down and right mouse button adjusts the range. Hitting space bar
resets the scale. Up and down arrows can be used to change the
colormap. If ‘interactive’, translates to (‘RdBu_r’, True). Defaults to
‘RdBu_r’.
fig : matplotlib figure | None
Figure instance to draw the image to. Figure must contain two axes for
drawing the single trials and evoked responses. If None a new figure is
created. Defaults to None.
axes : list of matplotlib axes | None
List of axes instances to draw the image, erp and colorbar to.
Must be of length three if colorbar is True (with the last list element
being the colorbar axes) or two if colorbar is False. If both fig and
axes are passed an error is raised. Defaults to None.
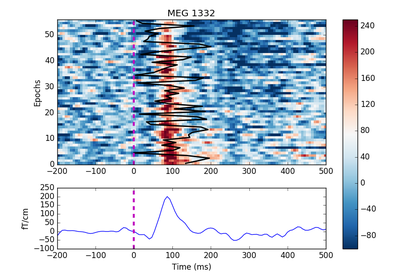
overlay_times : array-like, shape (n_epochs,) | None
If not None the parameter is interpreted as time instants in seconds
and is added to the image. It is typically useful to display reaction
times. Note that it is defined with respect to the order
of epochs such that overlay_times[0] corresponds to epochs[0].
|