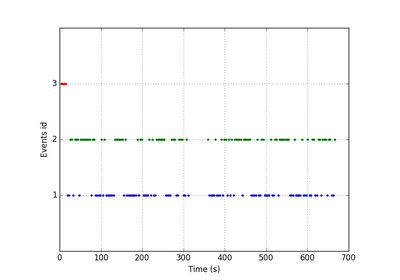
mne.viz.plot_events(events, sfreq=None, first_samp=0, color=None, event_id=None, axes=None, equal_spacing=True, show=True)[source]¶Plot events to get a visual display of the paradigm.
| Parameters: | events : array, shape (n_events, 3)
sfreq : float | None
first_samp : int
color : dict | None
event_id : dict | None
axes : instance of matplotlib.axes.AxesSubplot
equal_spacing : bool
show : bool
|
|---|---|
| Returns: | fig : matplotlib.figure.Figure
|
Notes
New in version 0.9.0.