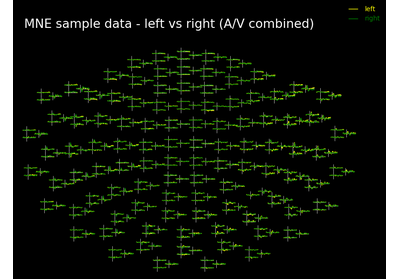
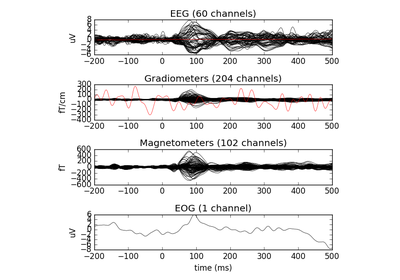
evoked : list of Evoked | Evoked
The evoked response to plot.
layout : instance of Layout | None
Layout instance specifying sensor positions (does not need to
be specified for Neuromag data). If possible, the correct layout is
inferred from the data.
layout_scale: float
Scaling factor for adjusting the relative size of the layout
on the canvas
color : list of color objects | color object | None
Everything matplotlib accepts to specify colors. If not list-like,
the color specified will be repeated. If None, colors are
automatically drawn.
border : str
matplotlib borders style to be used for each sensor plot.
ylim : dict | None
ylim for plots (after scaling has been applied). The value
determines the upper and lower subplot limits. e.g.
ylim = dict(eeg=[-20, 20]). Valid keys are eeg, mag, grad, misc.
If None, the ylim parameter for each channel is determined by
the maximum absolute peak.
scalings : dict | None
The scalings of the channel types to be applied for plotting. If None,`
defaults to dict(eeg=1e6, grad=1e13, mag=1e15).
title : str
proj : bool | ‘interactive’
If true SSP projections are applied before display. If ‘interactive’,
a check box for reversible selection of SSP projection vectors will
be shown.
vline : list of floats | None
The values at which to show a vertical line.
fig_facecolor : str | obj
The figure face color. Defaults to black.
fig_background : None | numpy ndarray
A background image for the figure. This must work with a call to
plt.imshow. Defaults to None.
axis_facecolor : str | obj
The face color to be used for each sensor plot. Defaults to black.
font_color : str | obj
The color of text in the colorbar and title. Defaults to white.
merge_grads : bool
Whether to use RMS value of gradiometer pairs. Only works for Neuromag
data. Defaults to False.
legend : bool | int | string | tuple
If True, create a legend based on evoked.comment. If False, disable the
legend. Otherwise, the legend is created and the parameter value is
passed as the location parameter to the matplotlib legend call. It can
be an integer (e.g. 0 corresponds to upper right corner of the plot),
a string (e.g. ‘upper right’), or a tuple (x, y coordinates of the
lower left corner of the legend in the axes coordinate system).
See matplotlib documentation for more details.
show : bool
|