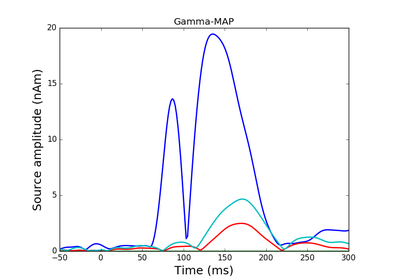
mne.viz.plot_sparse_source_estimates(src, stcs, colors=None, linewidth=2, fontsize=18, bgcolor=(0.05, 0, 0.1), opacity=0.2, brain_color=(0.7, 0.7, 0.7), show=True, high_resolution=False, fig_name=None, fig_number=None, labels=None, modes=(‘cone’, ’sphere’), scale_factors=(1, 0.6), verbose=None, **kwargs)[source]¶Plot source estimates obtained with sparse solver.
Active dipoles are represented in a “Glass” brain. If the same source is active in multiple source estimates it is displayed with a sphere otherwise with a cone in 3D.
| Parameters: | src : dict
stcs : instance of SourceEstimate or list of instances of SourceEstimate
colors : list
linewidth : int
fontsize : int
bgcolor : tuple of length 3
opacity : float in [0, 1]
brain_color : tuple of length 3
show : bool
high_resolution : bool
fig_name :
fig_number :
labels : ndarray or list of ndarrays
modes : list
scale_factors : list
verbose : bool, str, int, or None
**kwargs : kwargs
|
|---|---|
| Returns: | surface : instance of mlab Surface
|
mne.viz.plot_sparse_source_estimates